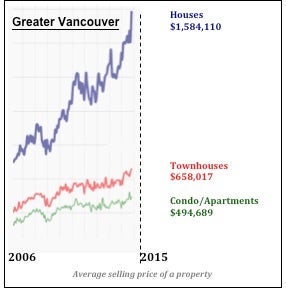
Even with all the other things to watch this year – elections, international events, economic news – the sport we call “the real estate market” has dominated both local news and conversations.As this 10-year graph for Greater Vancouver shows, home prices have been on a steady trend upwards, with this year, 2015, showing one of the steepest parts of the trendline.
 Burnaby North saw a one-year price increase over 24% (Benchmark Price of a “typical” property) for detached houses. The five-year gains for houses was an amazing 57.7%. In The Crest, houses enjoyed a lift of 20.4% over the past 12 months, while the townhouse Benchmark Price was up only 2.8%.
Other sub areas in the Lower Mainland have started to see apartment and townhouse prices rising, as people opt for the less expensive options.The market forces at play – low interest rates, a low Canadian dollar, population growth, a growing economy, and a desirable lifestyle – are all projected to continue for at least a year or two.
Statistics Source: Real Estate Board of Greater Vancouver

